In SERVIR regions, where long-term ground-based rainfall observations are limited, the need for satellite and model-derived rainfall data is critical for predicting droughts, estimating crop yields, and more. Decision-makers require precise tools to assess drought severity, compare it to past events, and gauge its potential impact on agriculture. These assessments hinge on accurate measurements of rainfall variations over both space and time. To properly evaluate how an unusually dry season fits into historical patterns, it is essential to analyze rainfall deficits in context. Previously, rainfall data was often limited to specific points on the Earth's surface, which failed to capture the full regional variability needed to understand overall rainfall trends.
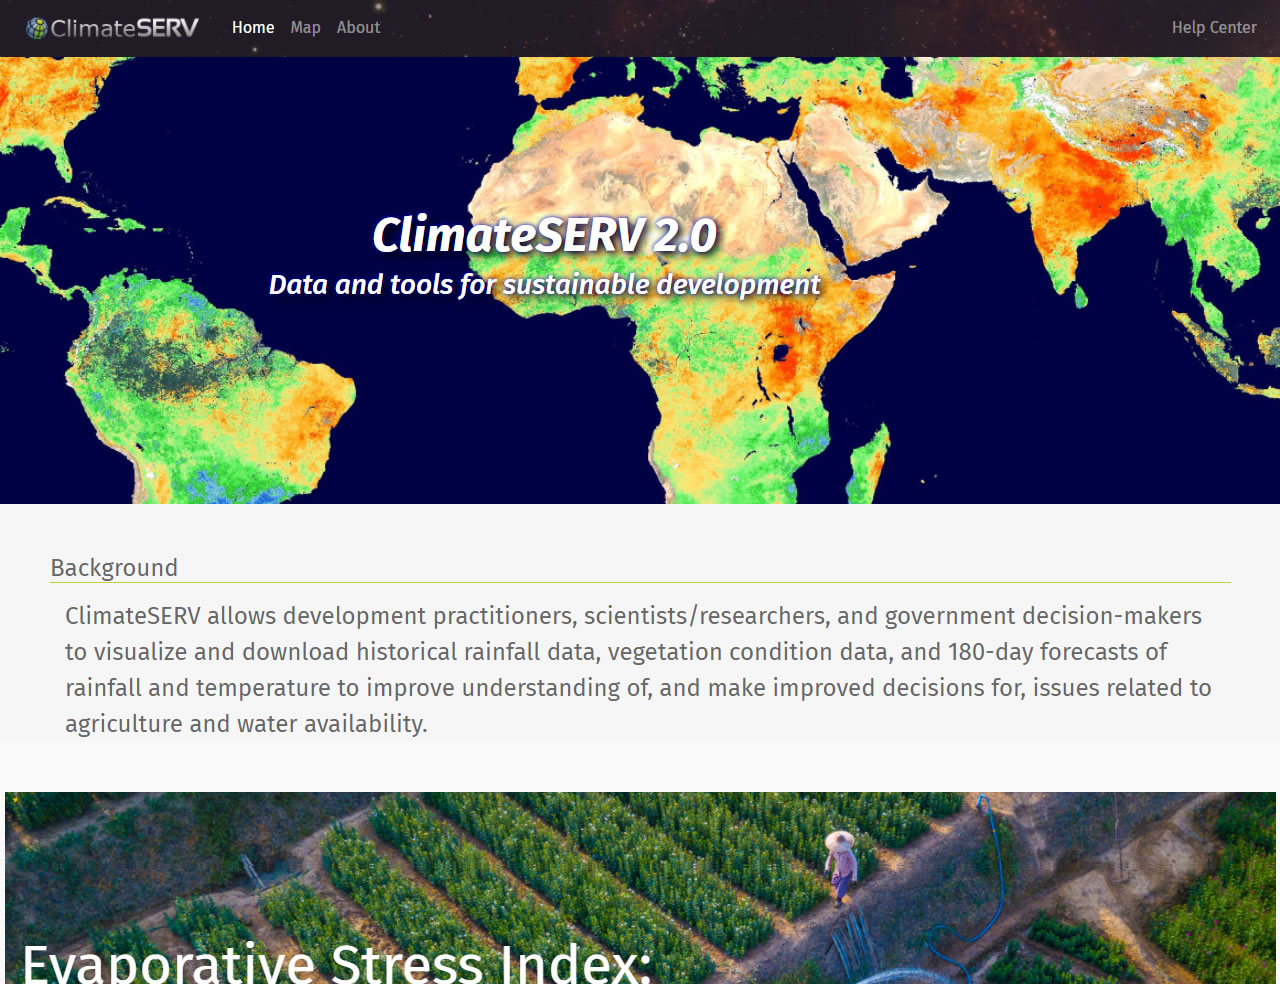
Application Purpose
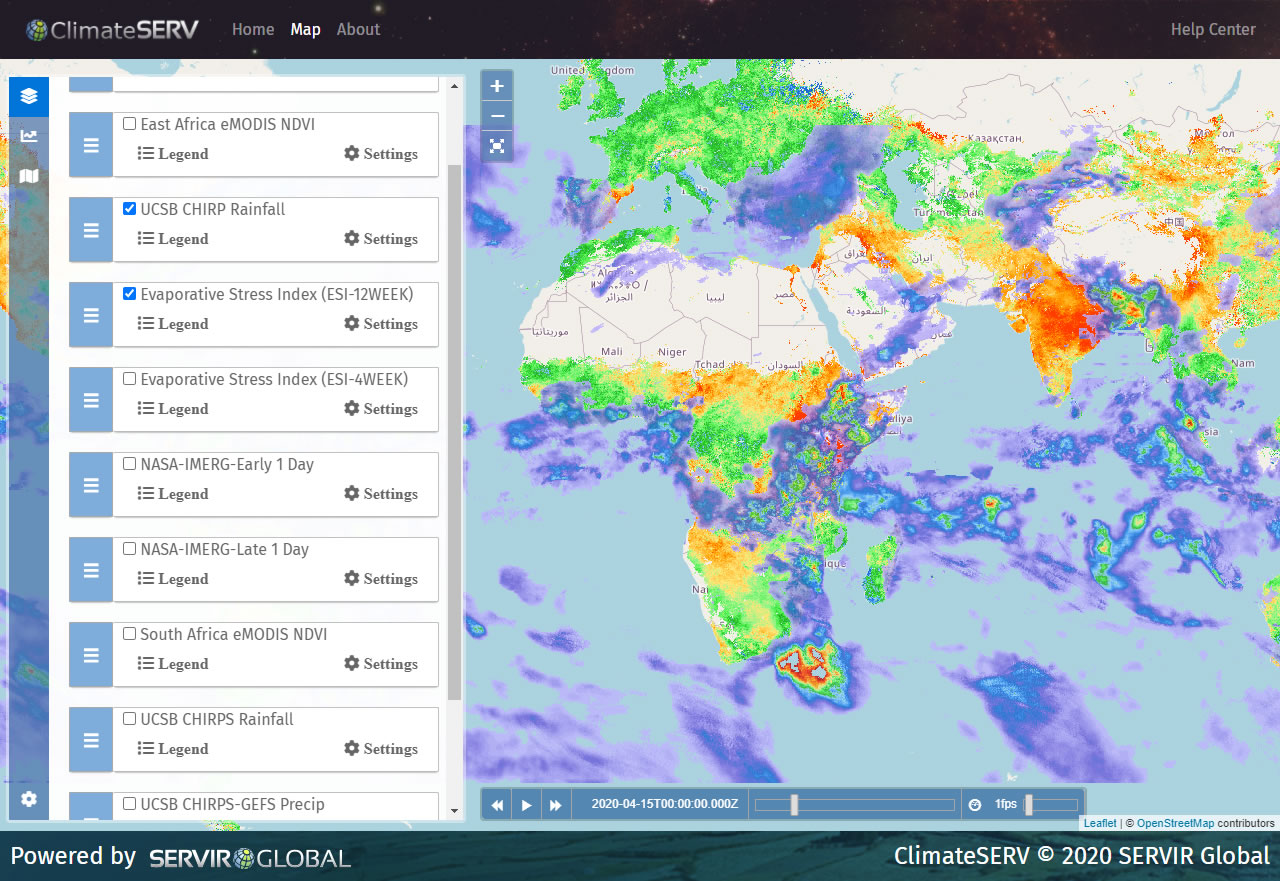
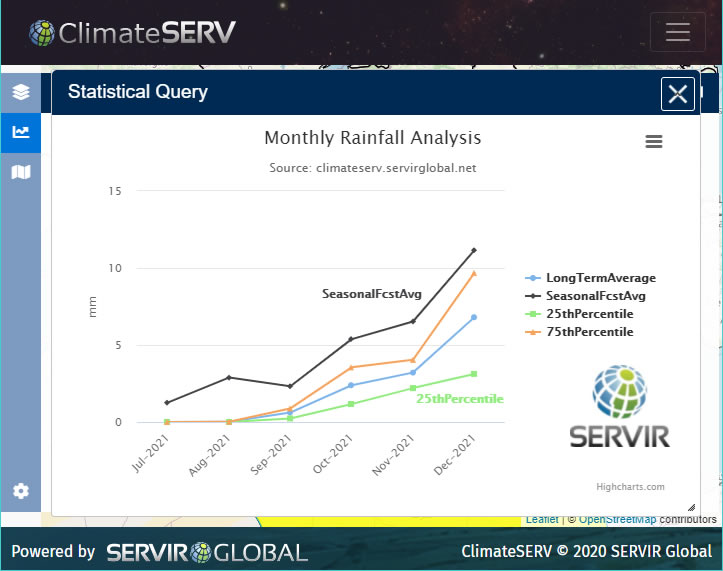
SERVIR has developed a user-friendly, web-based tool called ClimateSERV, designed to bring together several key datasets in one platform, enabling decision-makers in data-scarce regions to perform comprehensive analyses of climate, water, and agriculture trends. With ClimateSERV, development practitioners, scientists, and government officials can easily examine 30 years of historical rainfall data and compare it to the best available forecasts for the next 180 days within their area of interest. This holistic approach improves their understanding of critical issues related to agriculture and water availability, allowing for more informed decision-making. The tool's three essential datasets are:

(1) Climate Hazards group IR Precipitation with Stations (CHIRPS)
Scientists from the Famine Early Warning Systems Network (FEWS NET), as part of the SERVIR Applied Sciences Team, have compiled an unparalleled 30-year (1982-present) global record of satellite-derived rainfall data by integrating multiple satellite sources and ground observations. This dataset, known as CHIRPS, offers a spatially and temporally consistent view of global rainfall patterns, enabling accurate monitoring and assessment of large-scale trends. With CHIRPS, researchers can analyze how rainfall patterns may be impacted by climate change. The data is regularly updated with the latest available rainfall estimates, ensuring up-to-date insights.
(2) North American Multi-Model Ensemble (NMME) dataset
Accurate precipitation forecasts are crucial for decision-makers. The NMME dataset, compiled by the National Oceanic and Atmospheric Administration (NOAA), represents state-of-the-art work in seasonal forecasting. A SERVIR AST project has enhanced the NMME data by applying bias correction and spatial disaggregation using widely accepted techniques. This process generates daily temperature and precipitation forecasts for up to 180 days, covering the entire globe. When combined with CHIRPS historical rainfall data, these seasonal forecasts offer a comprehensive view, linking past rainfall patterns to future projections, providing a valuable tool for anticipating weather trends and planning accordingly.

(3) MODIS-derived Normalized Difference Vegetation Index (eMODIS NDVI)
SERVIR is also piloting the USGS pentadal eMODIS NDVI dataset, which provides 250m spatial resolution data over West Africa. NDVI, an indicator of vegetation health, serves as a proxy for agricultural productivity by measuring photosynthetic activity. By offering a 15-year NDVI dataset, SERVIR empowers Ministries of Agriculture and international donors to explore how CHIRPS rainfall data and NMME forecasts relate to vegetation growth and health. This dataset is also being expanded to other regions of Africa and beyond. Through ClimateSERV, decision-makers can link historical precipitation trends (CHIRPS) with past vegetation conditions (NDVI) to predict potential vegetation growth and health using seasonal precipitation and temperature forecasts (NMME) for up to 180 days.
Application Uses
With ClimateSERV, decision-makers can easily download, view, graph, and interpret CHIRPS, eMODIS NDVI, and NMME seasonal forecast data through a web-based interface. This tool helps users assess large-scale rainfall patterns, analyze the potential impacts of climate change, evaluate drought likelihood, and infer crop conditions. For instance, Kenya Meteorological Service (KMS) field offices are already using CHIRPS data to guide farmers on climate resilience strategies. The KMS Kericho office leverages CHIRPS to downscale seasonal climate outlooks, aiding farmers in choosing crop varieties and determining planting times. SERVIR hubs plan to train end-users across their regions to utilize and analyze CHIRPS, NMME, and NDVI data via ClimateSERV. As the use of seasonal forecasts continues to rise, ClimateSERV helps convert complex datasets into actionable insights. For more information, visit the Help Center or explore use cases.
ClimateSERV is brought to you by SERVIR to address critical challenges in climate change, food and water security, water-related disasters, land use, and air quality.
For more information on the SERVIR program, visit
https://servirglobal.net
![]()
The SERVIR Project makes no express or implied warranty as to the accuracy of the map or as to the merchantability or fitness for a particular purpose of the data. Neither the US Government nor its contractors shall be liable for special, consequential or incidental damages attributed to this data.