Overview
The ClimateSERV map provides tools to visualize climate related datasets which help to identify where and when specific events happen around the world. Along with the visualization capabilities, ClimateSERV offers the Statistical Query tool which helps answer climate questions specific to your area of interest (AOI) through analysis and extraction of data subsets clipped to your AOI and filtered by the desired time range. This tool gives you the option to display the statistics in an interactive graph, download the statistical data, or even download the raw data for further analysis.
Statistics
The ClimateSERV Statistical Query tool is a great way to identify and assess climate related questions specific to your area of interest (AOI). You can Query Countries, Administrative boundaries, or even draw your own AOI. This tool is useful for generating Graphs that can be used by local decision makers when assessing situations such as large-scale rainfall patterns, predicting droughts, estimating crop yields, and more.
To get started with this tool you will need to open the Statistical Query tab at the top left of the map. Once there you will notice there are three ways to specify your AOI.
- Draw the area using the drawing tools available in the map area (you will be able to download your AOI as a GeoJson file after you perform the analysis)
- Upload a saved GeoJson file defining your AOI in lat, lon coordinates (coordinates must be expressed in decimal degrees). You may use third party tools to convert your geometry to geojson, or to draw and save your AOI - for example: https://geojson.io/
- Select one or more administrative units shown in the map.
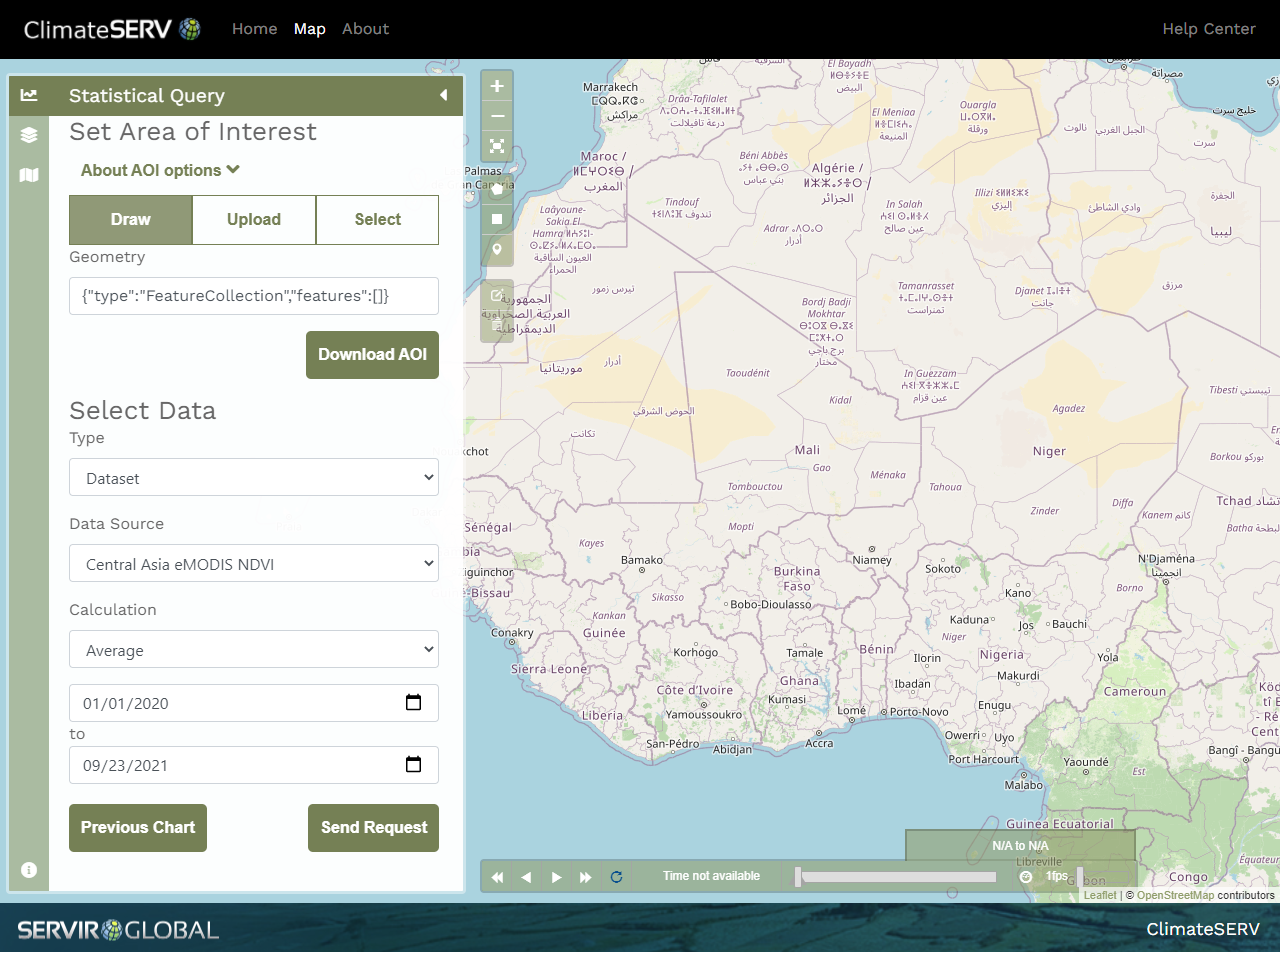
Once you have selected your AOI, you can choose either to query a specific dataset or to generate the Monthly Rainfall Analysis which is derived from a combination of CHIRPS historical data and current NMME Seasonal Forecast data.
If you choose Monthly Rainfall Analysis there are no further steps needed, you may submit the query and wait for ClimateSERV to process the results for your AOI.
If you choose dataset, you will next select a Data Source from the dropdown list. After this selection you may request the calculation Average, Min, Max, or Download. The first three options will generate a graph where the statistical data has that operation applied to it. If you select download you will be presented with a link to download the raw data when precessing is complete. For all AOI types except point(s) you will receive zipped tif files, for point you will receive a csv with the data values.
The final step here s to select the date range you would like to query and send the request. Due to increased demand in ClimateSERV services, a limit of 20 years of data per request has been implemented.
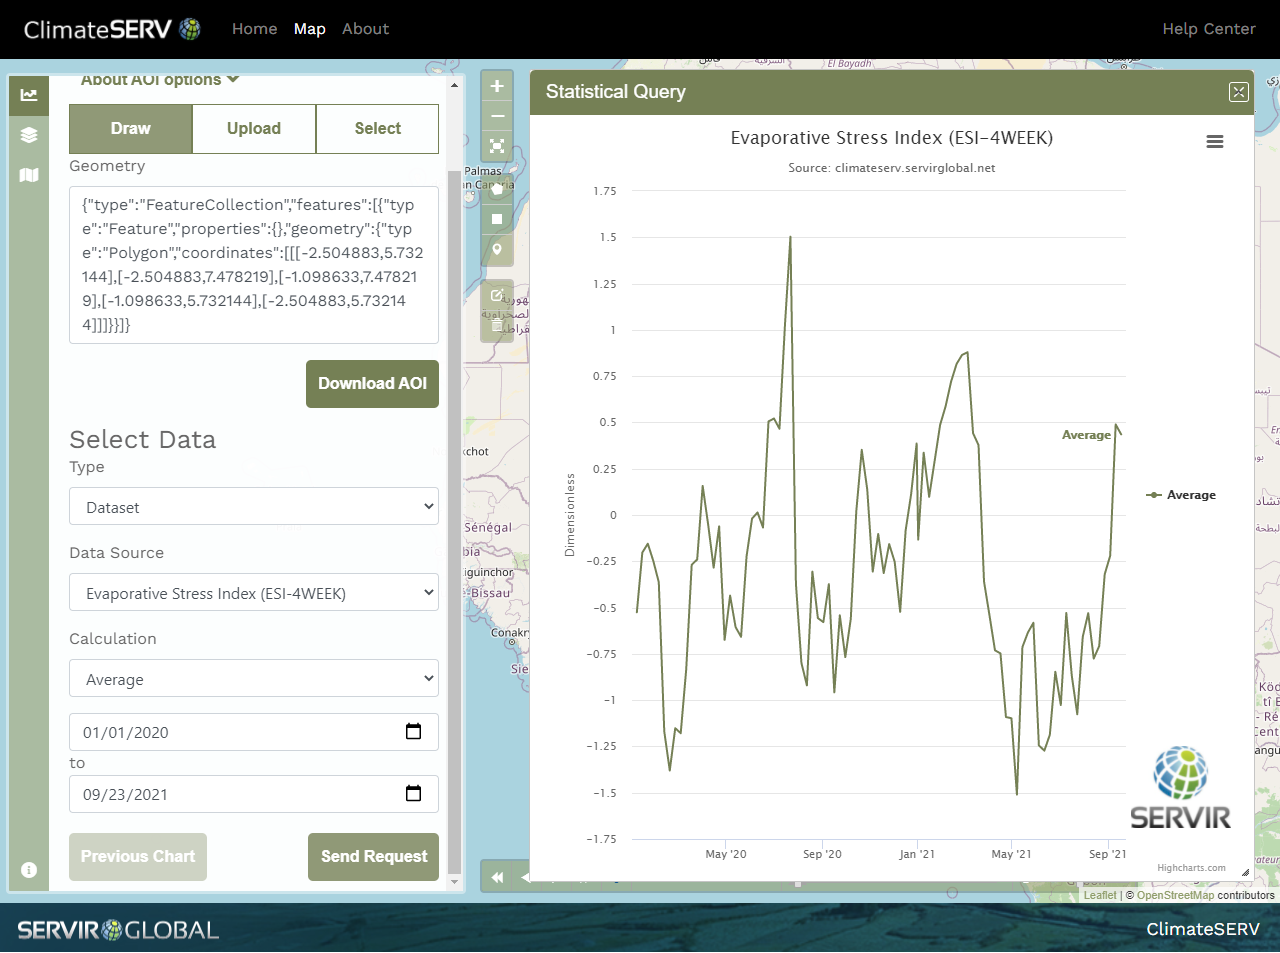
When your dataset query has finished processing you will be provided with an interactive graph that you can mouse over each point to see values for specific dates. Also in the top right corner of the graph is a menu which gives you options to "View in full screen", "Print chart", "Download PNG", "Download JPEG", "Download PDF", "Download SVG", "Download CSV", "Download XLS", or "View data table." These options make saving and sharing your findings very convenient.
Visualize
ClimateSERV is full of data layers that you can visualize on the interactive map. This can help you identify climate patterns and trends that can be difficult to see using tabular data. Visually interacting with the different data in your AOI and time period make it possible to comprehend, obtain insight, and even make decisions much more quickly. You can even see the data animate though time to help you pinpoint the exact moment an event happened.
To get started with visualization you will need to open the Layers tab at the top left of the map. Once open, you will notice a filter box that can help you quickly filter to the specific data you are interested in simply by typing a letter or two. Of course you may just scroll through the layers as well. Once you have found the data you would like, click the box next to it to enable it on the map. You may add multiple layers to the map if you would like. To change the order of the layers on the map simply drag the layer by the handle up or down placing the layer you want to be on top above the other layers. You will see the layers change in realtime as you drag them.
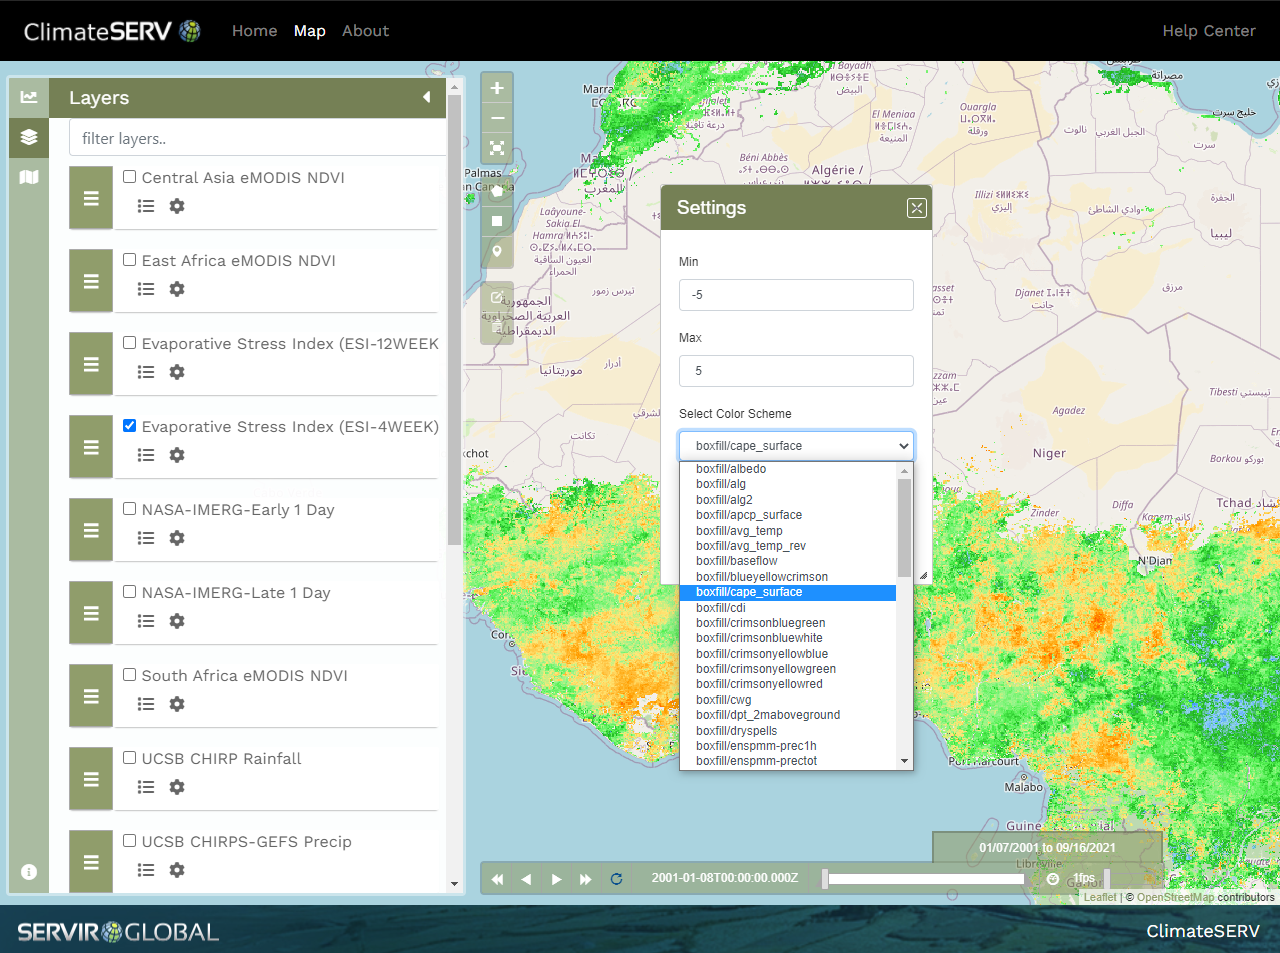
The layers all have default vision parameters, however you may want to adjust these to identify specific features of the data better. The gear icon in each of the layers will open a settings panel where you can set the data min and max values to be displayed as well as the color scheme to use. These settings will only apply to that specific layer, each layers settings are independent of the rest. You will also notice there is an opacity slider that allows you to dynamically adjust the opacity of the layer.
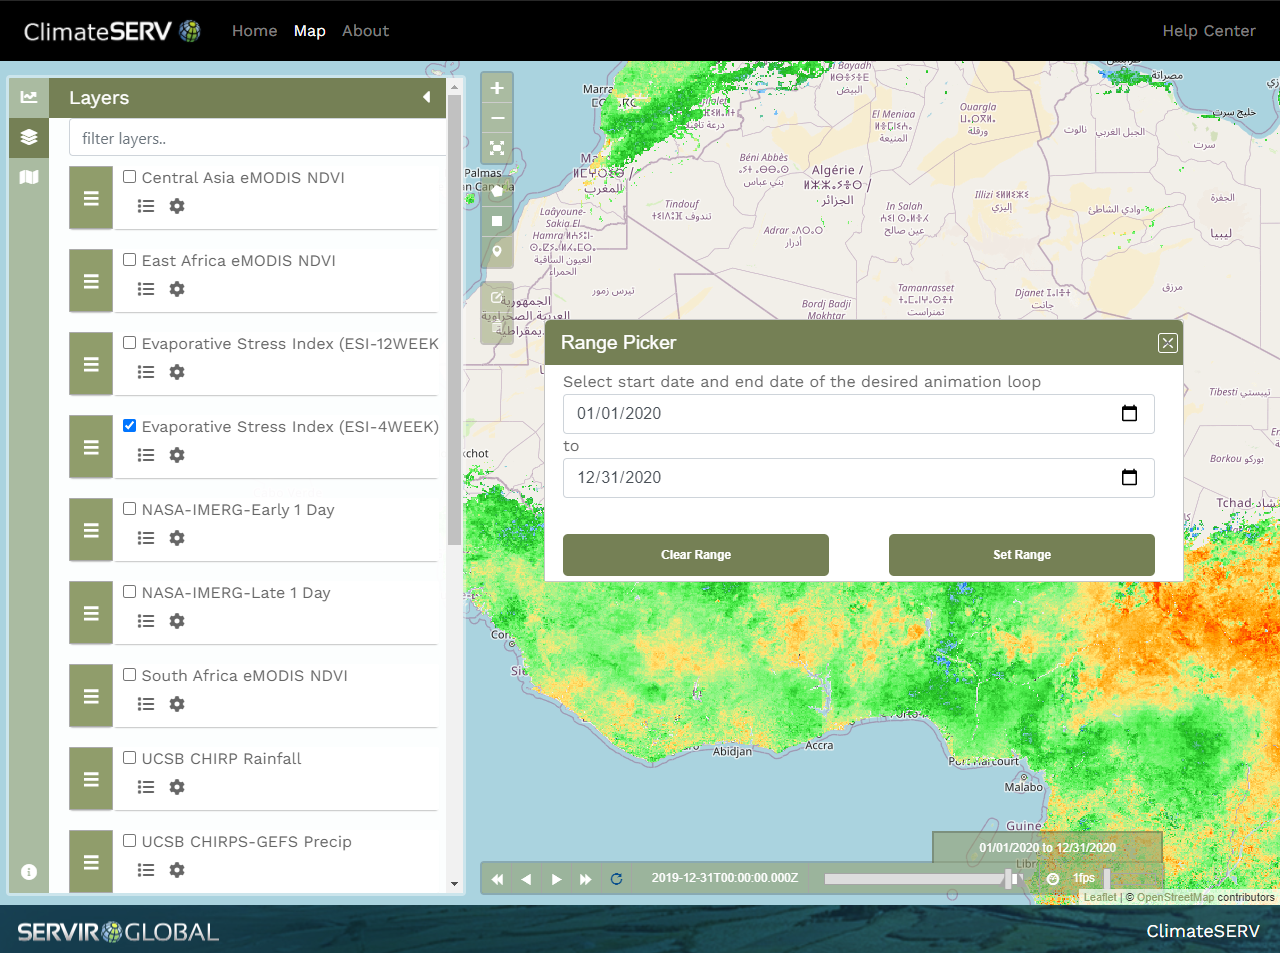
Last but not least, ClimateSERV allows you to animate the data layers over time. At the bottom of the map you will notice a timeline. If there is a layer on the map the timeline is enabled. You can click play, play reverse, next frame, previous frame. There are range sliders on the timeline where you can narrow the range of the animation, however for fine tuning you can click on the date range at the top left of the timeline and it will open the range picker. Here you can set the date range directly. You will see the range sliders narrow to the range on the timeline and you when you play it will only play the data in that range.